One of our Digital Team’s favorite things to do is dig around in a site’s Google Analytics account, finding takeaways that can help our clients better meet their business goals. Understanding your visitors’ behavior can help you not only diagnose what parts of your marketing strategy are working (and which aren’t), but it can also give you insights into how your customers are interacting with your brand both online and offline.
There’s lots of information to be found in Analytics, but we have a few favorite reports we always start with when looking for actionable insights. Here’s how to find them, and a few examples of what you might look for.
P.S. - If you’re looking for ways to better use Analytics, check out our Better U: Analytics 101 resources.
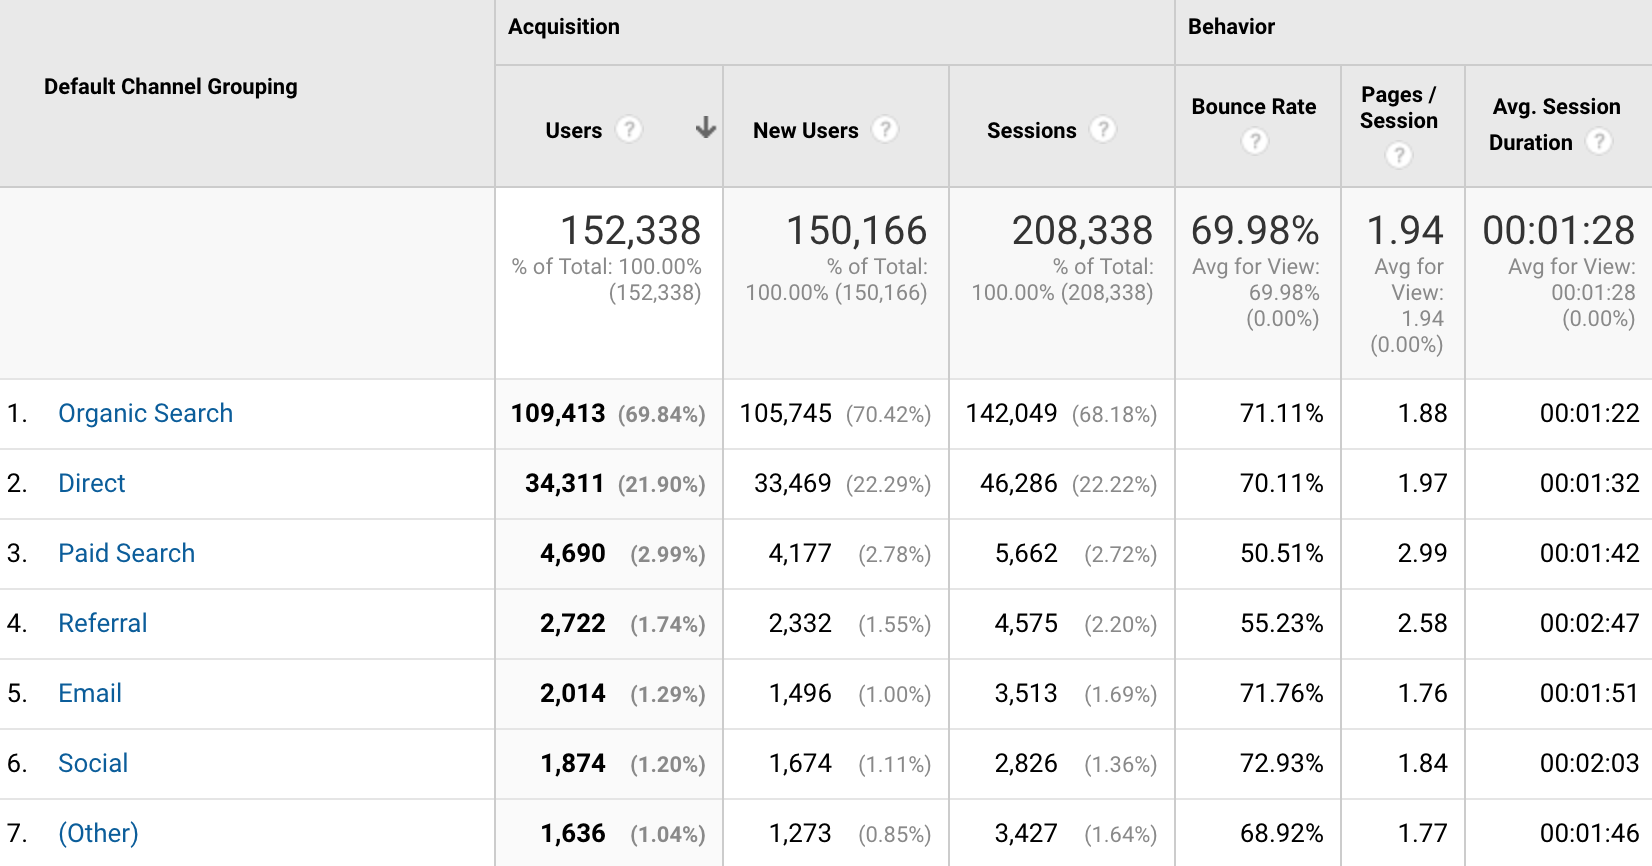
How to Get There: Acquisition > All Traffic > Channels
Why We Like It: This report shows the breakdown of how visitors are getting to your site, organized by the specific traffic source. It also includes acquisition and behavior metrics for each traffic channel, so you can see which sources are bringing the most new users to your site and which type of users are most engaged with your content (and therefore the most likely to become customers or leads).
This is the first place to start to see which of your marketing strategies are working and which need improvement. For example, if your Organic Search traffic is high, then you know search engines are driving visits. You can click on “Organic Search” to dig in deeper and figure out which pages are showing up in search engines and which keywords people are using to get to you. If your Organic Search traffic isn’t as high as you’d like (or if you’re not driving traffic for the pages or keywords you’d prefer), then you might want to spend some time on search engine optimization and content generation to make sure you’re getting in front of people who are searching for what you have to offer.
Likewise, if you find that traffic from Social sources is relatively low, but that behavior metrics like pages / session and average session duration are high, it might tell you that social media platforms could be a valuable source of engaged traffic if you put more resources towards them.
Each channel in this report has more specific information if you drill down, so you can evaluate what’s working within each channel and what isn’t. Additionally, if you have specific goals set up in Analytics (like form submissions, ecommerce tracking, or video views), you’ll be able to see those conversions for each traffic source here.
What You Should Know to Use This Report:
(For definitions of traffic channels and common Analytics terms, see our Analytics Glossary).
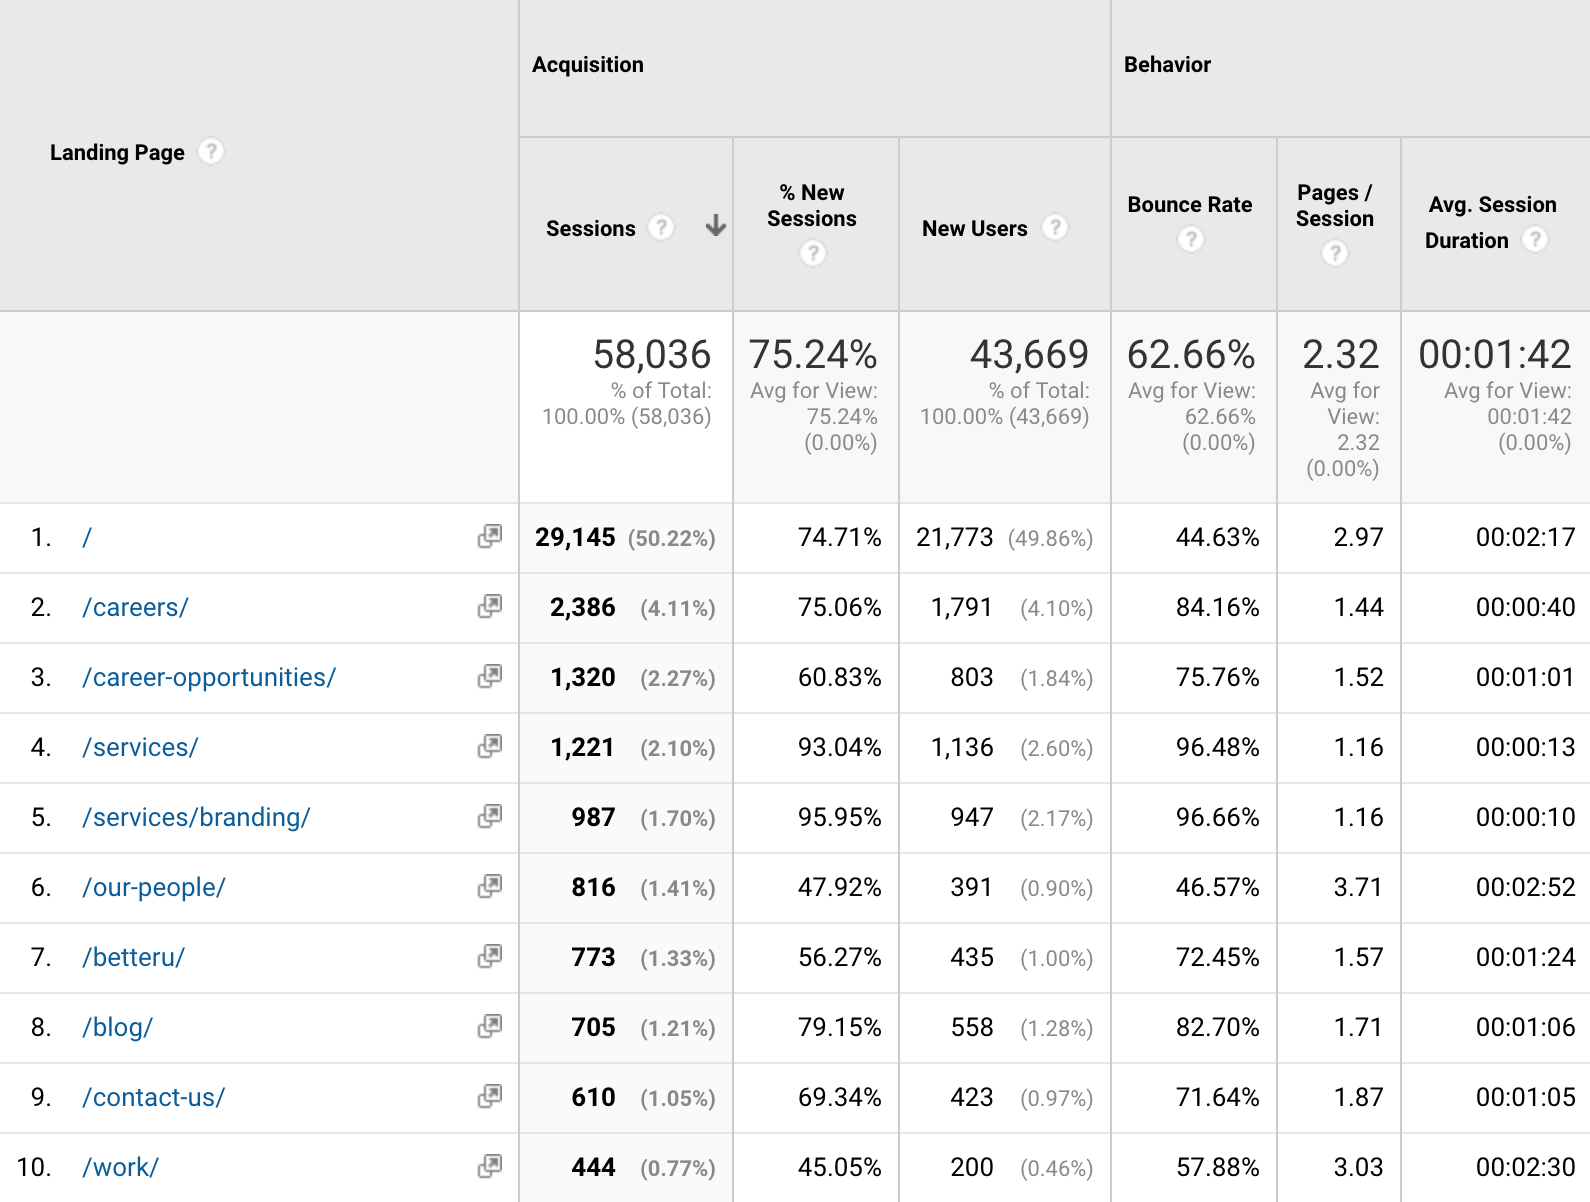
How to Get There: Behavior > Site Content > Landing Pages
Why We Like It: This report shows the same types of metrics as the Traffic Sources report, but you’ll notice that it’s organized by “Sessions,” and not “Users.” That’s because this report gives us detailed data about specific pages that bring in visits. “Landing pages” are a user’s entryway to your site—the first site they see during their session—and looking at this report gives you an idea which topics and content are working to introduce (or reintroduce) people to your brand, whether it’s through search engines, paid advertising, email, social media, or other channels. This is your hardest working content.
When looking at this report, we like to pay particular attention to bounce rate: a high bounce rate for a landing page means people who “land” there aren’t sticking around to interact, click on clicks, or otherwise engage with your brand. This is a missed opportunity to take advantage of traffic coming in.
Looking at your most popular landing pages can also give you an idea what content you might want to share in emails or feature prominently in your navigation or on your homepage—this is content people are interested in, whether they already know your brand or not.
What You Should Know to Use This Report:
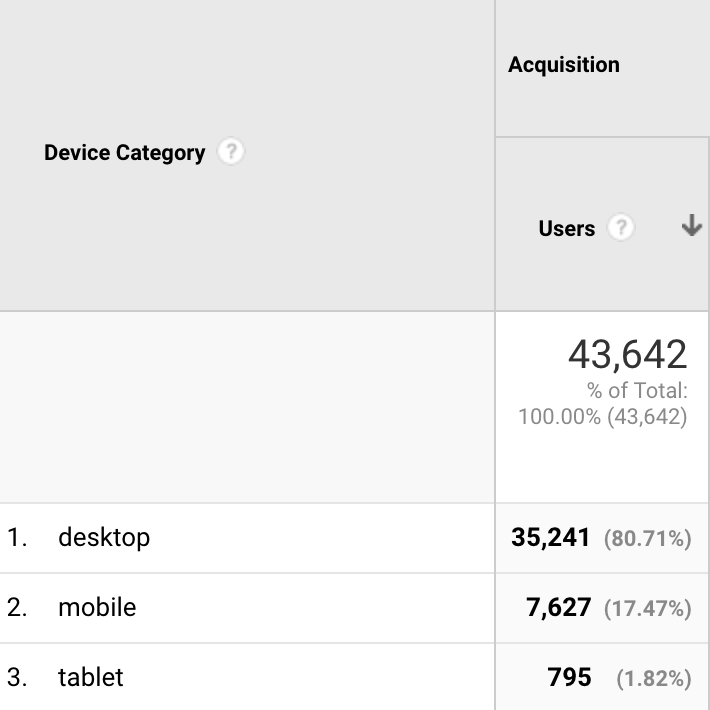
How to Get There: Audience > Mobile > Overview
Audience > Mobile > Devices
Why We Like It: Okay, these are really two separate reports, but since they’re right next to each other in Analytics and go hand-in-hand, we thought we’d talk about them together! It should be no secret that more and more internet traffic happens on a mobile device—in fact, over 78% of searches are now conducted on smartphones or tablets, and that number is only growing. If your site isn’t mobile-friendly, it will hurt you, not only with your visitors but with search engines, too.
The Mobile Overview report shows you what percentage of your traffic is using a desktop computer vs. a mobile device vs. a tablet. If your mobile and tablet percentages are low, you should verify that you’re providing a good user experience on mobile-devices, and that Google sees your site as mobile-friendly (one way to verify this is to use Google’s Mobile-Friendly Test).
The Mobile Devices report breaks down your smartphone and tablet traffic by device so you can ensure your content is performing on the tools your audience is using. Poor behavior metrics on specific devices can indicate user experience problems and should be investigated.
What You Should Know to Use This Report:
There’s a million ways to look at data in Analytics, but these reports should get you started and lead to information you can use. Happy Data-Digging!
Need help interpreting your data? Reach out!.