Better U: Google Analytics 101
Here’s a question for you: How often do you look at your site’s Google Analytics account? Unless you’re a data guru, the answer is probably “not often enough.” Analytics is an incredibly useful (and free!) tool that can seem overwhelming—that’s why we’ve put together some key takeaways and resources to help you get more out of your website data and achieve your goals faster.
This information was originally presented at our Analytics 101 Workshop through Willow Better U: a series of free courses designed to give you the tools you need to better grow your organization. Learn about upcoming Better U workshops here.
The Value of Analytics
Google Analytics is more than just numbers and stats. It tells the story of how people are interacting with your brand online — what they have questions about, what they’re most interested in, who they are, and more. How can you position your website to be an effective tool for your organization and customers if you don’t know what story your website may or may not be telling? That’s why it’s important to make Analytics a regular part of your business strategy.
How Google Analytics Works
- A piece of tracking code (with your unique analytics account number) gets added to every page of your site
- The code collects data about visitors that land on these pages
- This information is sent to your Analytics account (analytics.google.com) for viewing
- Within your Analytics dashboard, you can view, filter, and sort this data to better understand how people get to your site, what they’re doing while they’re there, a bit about who they are, and what content works (and what doesn’t)!
Interpreting your Analytics data is a lot easier when you understand the different terminology used—go here for a helpful glossary of Analytics terms.
Types of Information Available in Analytics
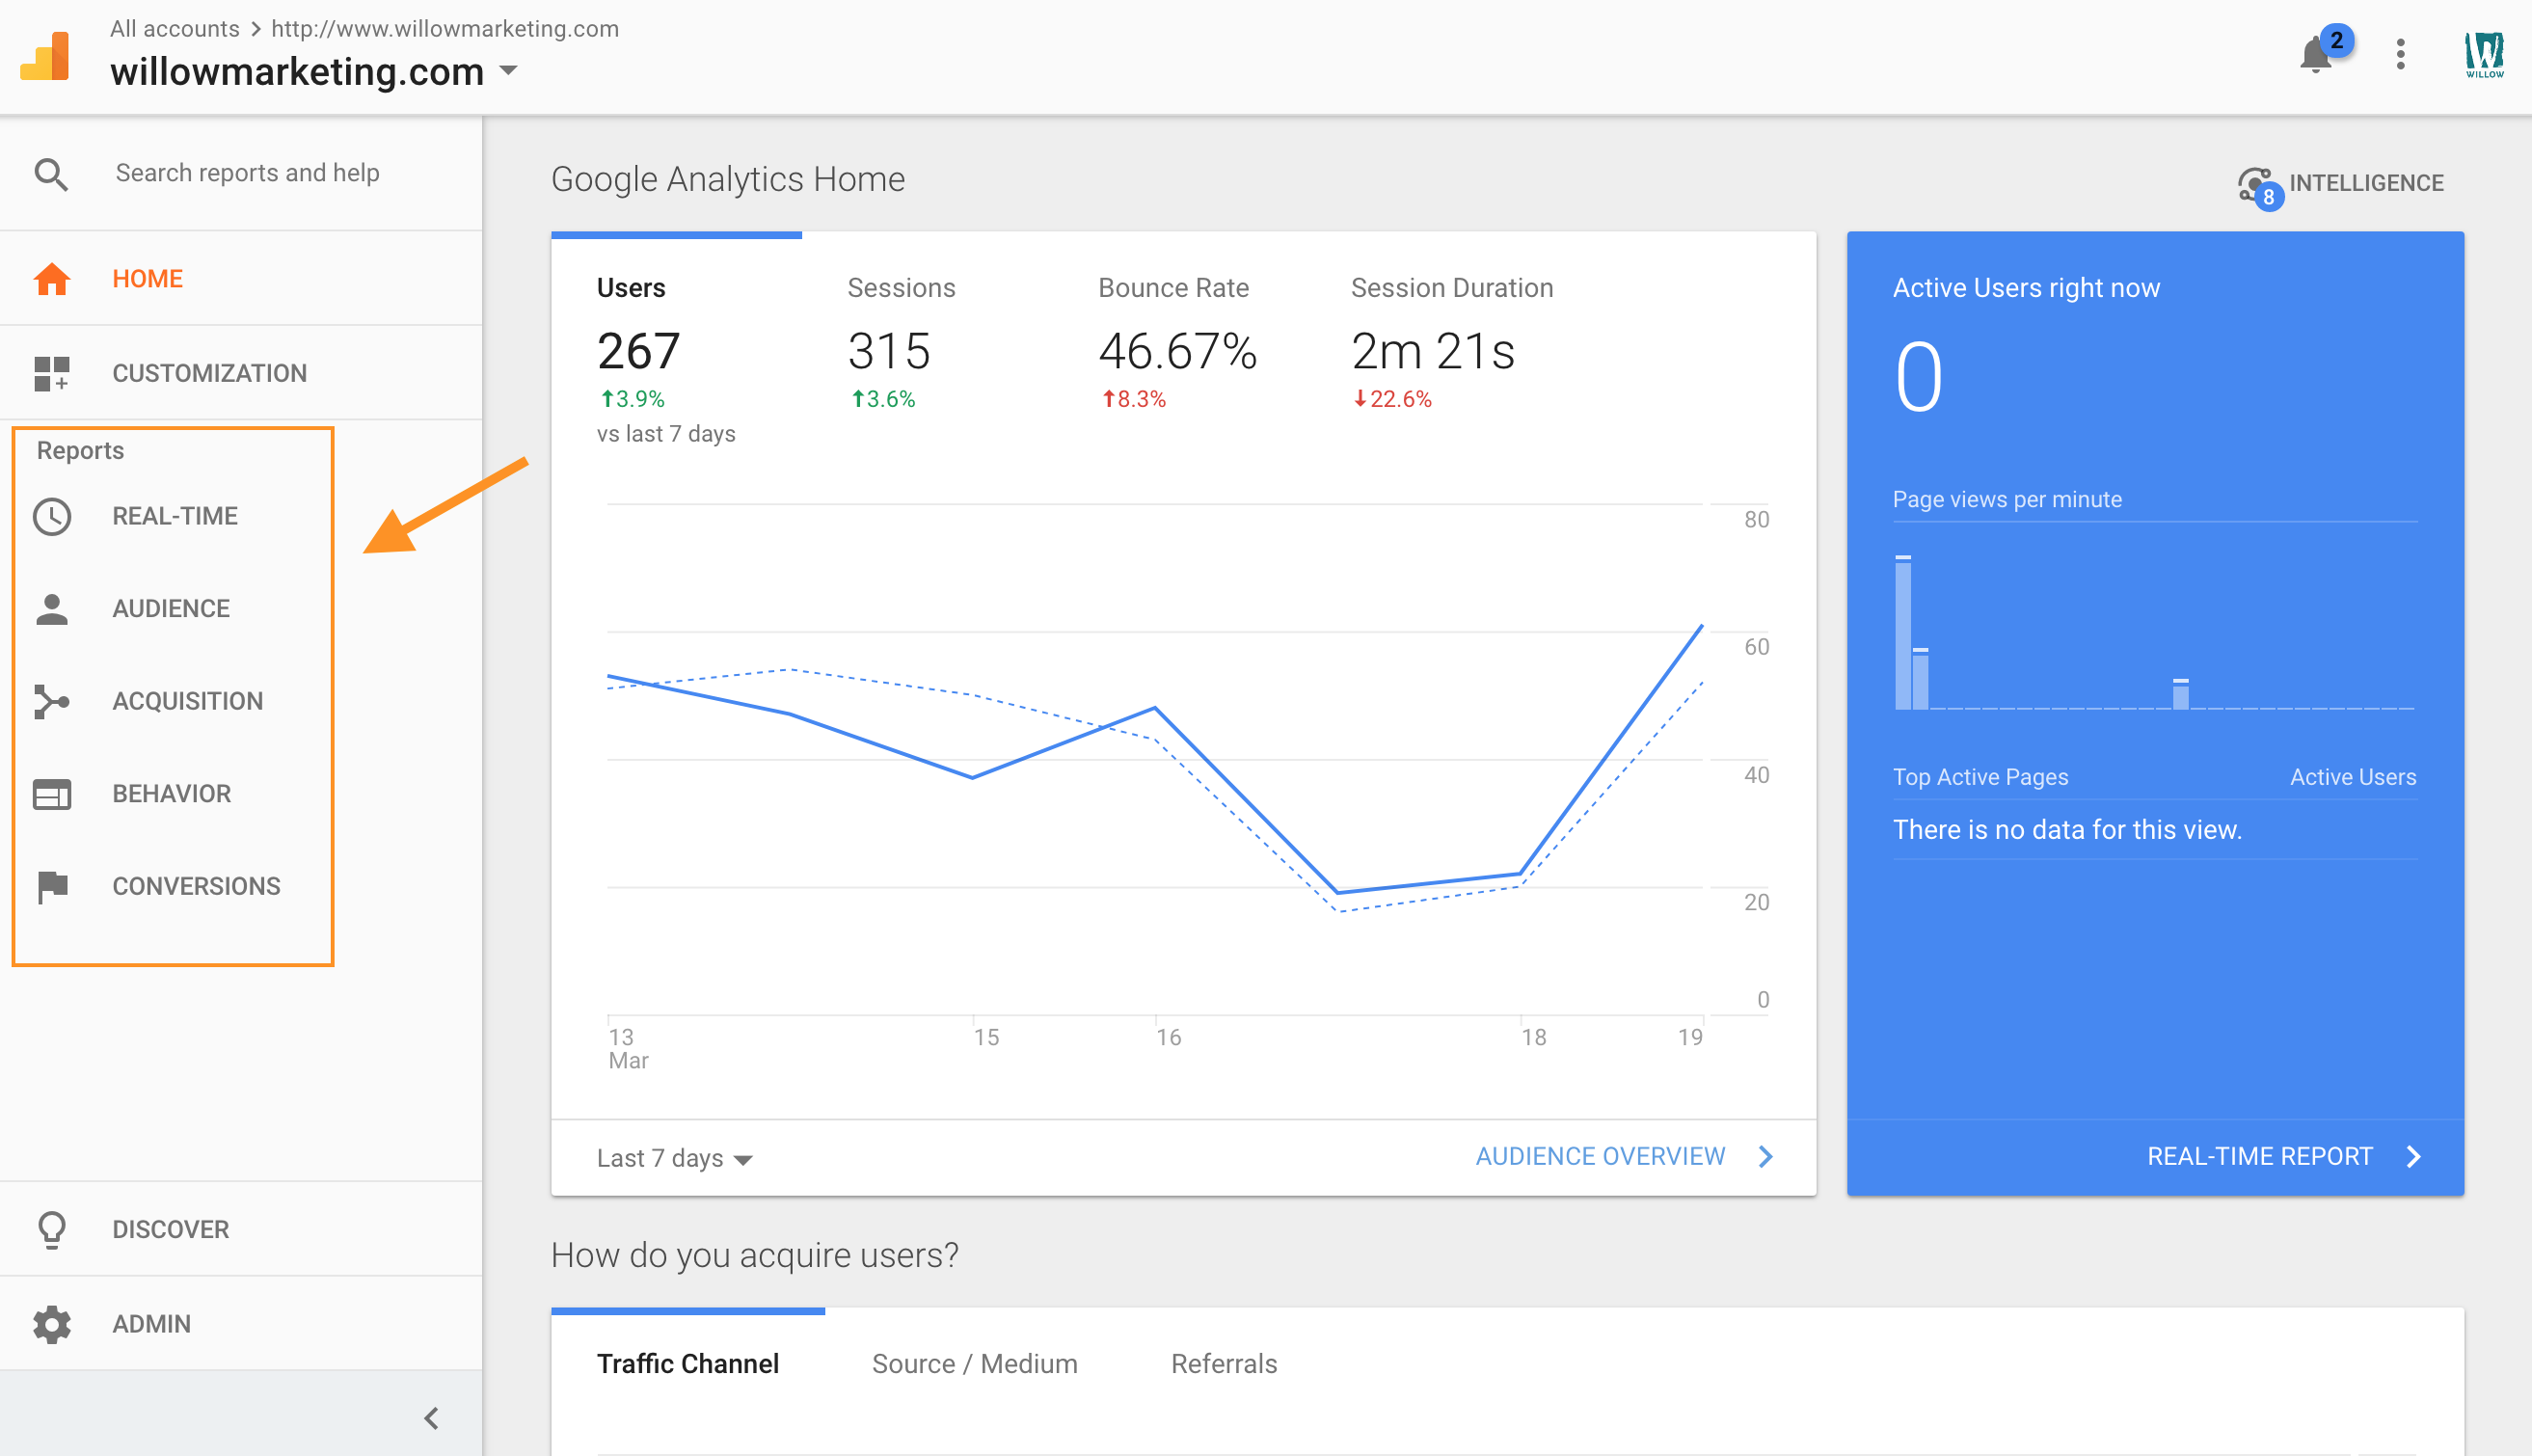
While there’s A LOT of info to be found in Analytics, here are the main categories of information available:
Real-Time Reports:
This is live data — i.e., it’s where you can find out how many people are on your site at this very moment, what they’re doing, and where they came from. While fun to play with, you probably won’t use this section very often, unless you’re trying to make sure your site and Analytics code are working correctly or want in-the-moment results for a specific campaign (an on-air commercial, for example).
Audience Reports:
This category of reports is where you can find demographic, geographic, and behavioral information about the users on your site. (But be forewarned — some of these reports need to be turned on and require additions to the privacy policy on your site.)
Some fun reports here:
- Mobile vs. Desktop traffic
(Audience > Mobile > Overview) - Age of Visitors
(Audience > Demographics > Age) - Geographic Location of Visitors
(Audience > Geo > Location, then drill down into country and state as needed)
Acquisition Reports:
Go here to understand how you’re acquiring your visitors, whether they’re coming through search engines, paid advertising, social media, links, or other sources. This is also your source for specific campaign data.
Some fun reports here:
- Overview Report
(Acquisition > Overview) - Traffic Sources
(Acquisition > All Traffic > Channels) - Organic Landing Pages (the pages that are bringing in traffic from search engines)
(Acquisition > Search Console > Landing Pages) - Traffic for Tagged Campaigns (traffic from UTM-tagged links, as described below in the “Campaign Tagging” section)
(Acquisition > Campaigns > All Campaigns)
Behavior Reports:
This is where you can find reports on the content on your site and how visitors are using it, whether it’s your homepage, a blog post, or your site search function.
Some fun reports here:
- Most Viewed Content
(Behavior > Site Content > All Pages) - Exit Pages (The pages from which a visitor is leaving your site)
(Behavior > Site Content > Exit Pages) - Event Tracking (If you have specific actions tagged with tracking code, as explained below)
(Behavior > Events)
Conversion Reports:
These are more advanced reports that require you to have set up goals or ecommerce tracking. These are perfect for when you have a specific conversion action you want people to take on your site, whether it’s to sign up for an event, fill out a contact form, or make a purchase.
The Conversion Reports section lets you see not only how many people complete these goals, but it will give you information about the path they took to get there — the funnel. We’ll explain ways to set this advanced tracking next.
Want to learn more about different Analytics reports? Read about our favorites (and how to interpret them) here.
Ways to Extend Tracking (Advanced)
Analytics has several features that help you track conversions, whatever a conversion might mean to your company. It could be a form submission, a purchase, or a view of a particular page. Setting up this kind of advanced tracking helps you connect website behavior with the metrics that matter for your business, helping you quantify your content development and marketing efforts in a tangible and real way (ROI).
A crucial first step to advanced tracking in Analytics is to calculate the value of a lead. If you don’t already know how much a lead is worth to your company, use our free lead value calculator to find out.
Analytics Goals
One of the first steps to setting up advanced tracking is to define “goals.” Goals in Analytics fall into one of 5 different types, as shown in this table from Google:
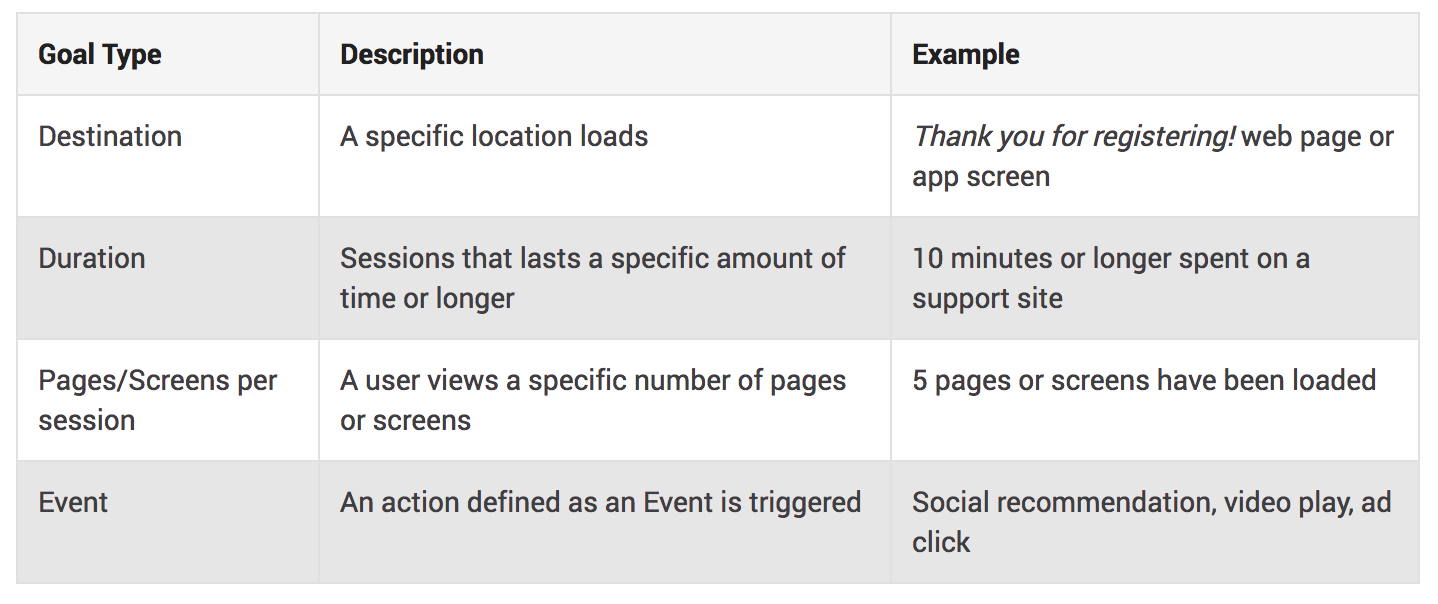
(from https://support.google.com/analytics/answer/1012040?hl=en)
You can set up goals by going to the Admin section of Analytics and clicking on “Goals” under the “View” column. You can add a new goal and choose how you want success to be measured—when a visitor lands on a specific destination (like a shopping cart page or thank you form), when they’ve spent a certain amount of time on the site, when they’ve viewed a certain number of pages, or when they’ve completed a specific event (for example, played a video). You’ll want to choose goals based on your most important business metrics. This is also where you can assign a monetary value to a goal and input the average value of a lead that you already calculated.
Note: If you choose an “Event” as a goal, you’ll need to have event tracking set up so Google knows what events are important to you (see section on Event Tracking below).
Funnels
Funnels are a way to visualize how visitors are behaving on the site, specifically in regards to the goals you’ve set up. Funnels allow you to get really granular with your pathways to conversion, letting you track the steps a user takes to get to a conversion. For example, you might want to set up a funnel that has people visiting the homepage, a category page, a product page, and then a shopping cart. Once you have a funnel set up, you can see where visitors drop off and fall out of your conversion funnel.
Funnels can be set up as part of the Goal process.
Event Tracking
Event tracking allows you to record specific actions that a user takes on your site, whether that’s playing a video, clicking on a an external link, or clicking through a slider image. In this way, you can track a visitor’s interaction with your content. As mentioned previously, these events can then be set up as goals and tracked more extensively throughout Analytics, or you can view a full report of the events you’ve set up by going to Behavior > Events.
Event tracking requires you to add some tagging to the code on your site—either manually or through Google Tag Manager.
Campaign Tagging
Campaign tagging allows you to assign certain parameters (for example, a source, medium, and campaign name) to a link so that any visits through that link are grouped in Analytics. This is also called “UTM tracking.” You might use campaign tagging on any link you post on Twitter (so you can later see the traffic that came through that specific post or campaign), in an email, or on print materials you send to your audience. Unlike the other advanced tracking methods we’re talking about, you don’t have to set up anything specific in Analytics or in the code of your site to use UTM tracking—you just need to ensure that the link you’re sharing includes the parameters by which you want to categorize that traffic. Once you do so, those parameters will automatically be communicated to your Analytics account, and you can find the data by going to Acquisition > Campaigns.
Google has a free UTM builder tool to help you add parameters to your links.
Not sure where to start with setting up advanced tracking for your site? We can help.
Ways to Make Getting Analytics Info Easy
All this info on Analytics tracking is great, but if you don’t have a lot of free time to spend digging around in your website data (who does?), how do you make sure you’re using it effectively?
One of the best ways to make Analytics part of your regular routine is to set up custom reports. You can do this in a couple ways:
Use the Built-in Analytics Reporting Feature:
Send out reports using Analytics’ built in feature—just make sure you train your team on how to interpret the reports, and that you talk about them regularly to ensure people are processing the data.
Tip: There are many reporting templates you can download for Analytics so you don’t have to build one from scratch, including ones provided by Google.
Build a Custom Dashboard for More Advanced Reporting:
If you want to see more rows of data than the built-in reporting allows or need advanced filtering, you can build custom reports in Google Data Studio or a similar tool. At Willow, we build custom dashboards for our clients so the Analytics data that’s most relevant to their business goals is right at their fingertips.
Next Steps: 5 Actions You Can Take to Move Forward
Ready to get going? Whether you’re a complete beginner, have some Analytics experience, or consider yourself an Analytics expert, we’ve put together the next 5 steps you can take to get more out of Analytics.
Download our checklist below!
Analytics Resources
Download the full presentation from Willow Better U: Analytics 101
Our Favorite Analytics Reports
Average Lead Value Calculator
Analytics Glossary
Next Steps Checklist